Every platform team has some version of the same problem: the map never quite kept up with the territory. A knowledge graph is a continuously refreshed model of your infrastructure, assembled from the tools you already run — and queryable.
Your Platform Is a Graph — You’re Just Not Querying It Yet
The Queryable Platform, part 1 of 4 — a series on building an infrastructure knowledge graph and putting agents on top of it. (Part 2 · Part 3 · Part 4)
A few jobs back I was building out alerting for a platform that, said with all affection, nobody fully understood. Not negligence — just years of growth where the map never quite kept up with the territory. By the time I got there it was 50-some microservices, with dependency chains between them that were anything but trivial, and that’s just what lived in Kubernetes. Never mind the legacy services running elsewhere, the databases, and the third-party APIs those chains passed through on their way to an answer.
The edge was easy: if the outermost service went down, we caught it and paged the right people. Done in a week. But the business didn’t care about the edge. The business wanted to know “are purchases through our card processor working right now?” and “are deposits via ACH going through?” — and answering those meant knowing every service sitting in the chain behind that edge. We flat couldn’t. You can’t write an alert condition for a dependency chain nobody can enumerate.
That job is behind me, but the problem isn’t — every platform team I’ve worked with since has some version of it. Which services in your prod cluster are exposed to the public internet, and who owns them? If answering that involves opening the ArgoCD UI, grepping some Helm values, checking CODEOWNERS, and then asking someone in Slack anyway, you’ve got the same disease. The knowledge exists, it’s just scattered across a half-dozen tools that don’t talk to each other, plus a healthy amount of tribal knowledge living in engineers’ heads.
Recently I’ve been building something to fix that: a knowledge graph of my infrastructure. This series walks through what that means, how to build one, and — the part I’m most excited about — what you can do with one once you have it. In this first article we’ll cover the what and the why.
First off — what is a knowledge graph, anyways?
Strip away the buzzword and a knowledge graph is a database of facts, where every fact is a three-part sentence called a triple: a subject, a predicate, and an object.
payment-api  runsIn       prod-cluster-east
payment-api  ownedBy      payments-team
payment-api  deployedBy   deploy-prod-pipeline
That’s it. Really nothing fancy. Subject, verb, object — the same grammar you learned in grade school, just stored in a database that’s built to be queried. Pile up enough of these little sentences and something interesting happens: they stop being a list of facts and start being a graph, because the object of one triple is the subject of another. payment-api runs in a namespace, that namespace runs in a cluster, that cluster is managed by a team, and suddenly you can walk from any node to any other node by following the edges.
The specific flavor we’ll be using is RDF (Resource Description Framework), which comes with a query language called SPARQL. If you’ve written SQL, SPARQL will feel familiar — the difference is that instead of joining tables, you describe a shape of connected facts and the database finds everything that matches:
SELECT ?service ?team WHERE {
  ?svc a kg:Service ;
       s:name ?service ;
       kg:exposes ?ingress ;
       kg:ownedBy ?owner .
  ?owner s:name ?team .
}
That query is the answer to the question I asked a few paragraphs up: every service with a public route, paired with its owner. One query, no Slack messages.
A little lore
RDF has some history to it. It came out of the early-2000s Semantic Web effort — Tim Berners-Lee’s vision of a web where machines could understand the meaning of data, not just render it. The academic wing of that movement got a bit carried away with formal ontologies and description logics, and RDF picked up a reputation for being ivory-tower stuff. But the bones underneath are solid engineering, and industry quietly kept using them: Google’s “Knowledge Graph” (the info boxes in your search results) put the term back on the map in 2012, and the same machinery runs underneath Wikidata and a surprising amount of enterprise data integration.
The theory behind ontologies and inference is beyond the scope of this series — for our purposes, all you need is triples, a schema to keep them consistent, and SPARQL to query them.
Why a platform engineer would want one
Here’s the thing about platform engineering: the questions we get asked all day are relational. Not “what is the memory limit on this pod” — your monitoring answers that — but questions that hop across tool boundaries:
- Which Argo apps deploy into this cluster, and from which repos?
- What Vault paths does this service depend on?
- If I rotate this database, what breaks?
- Which VirtualServices route traffic to services that no longer exist?
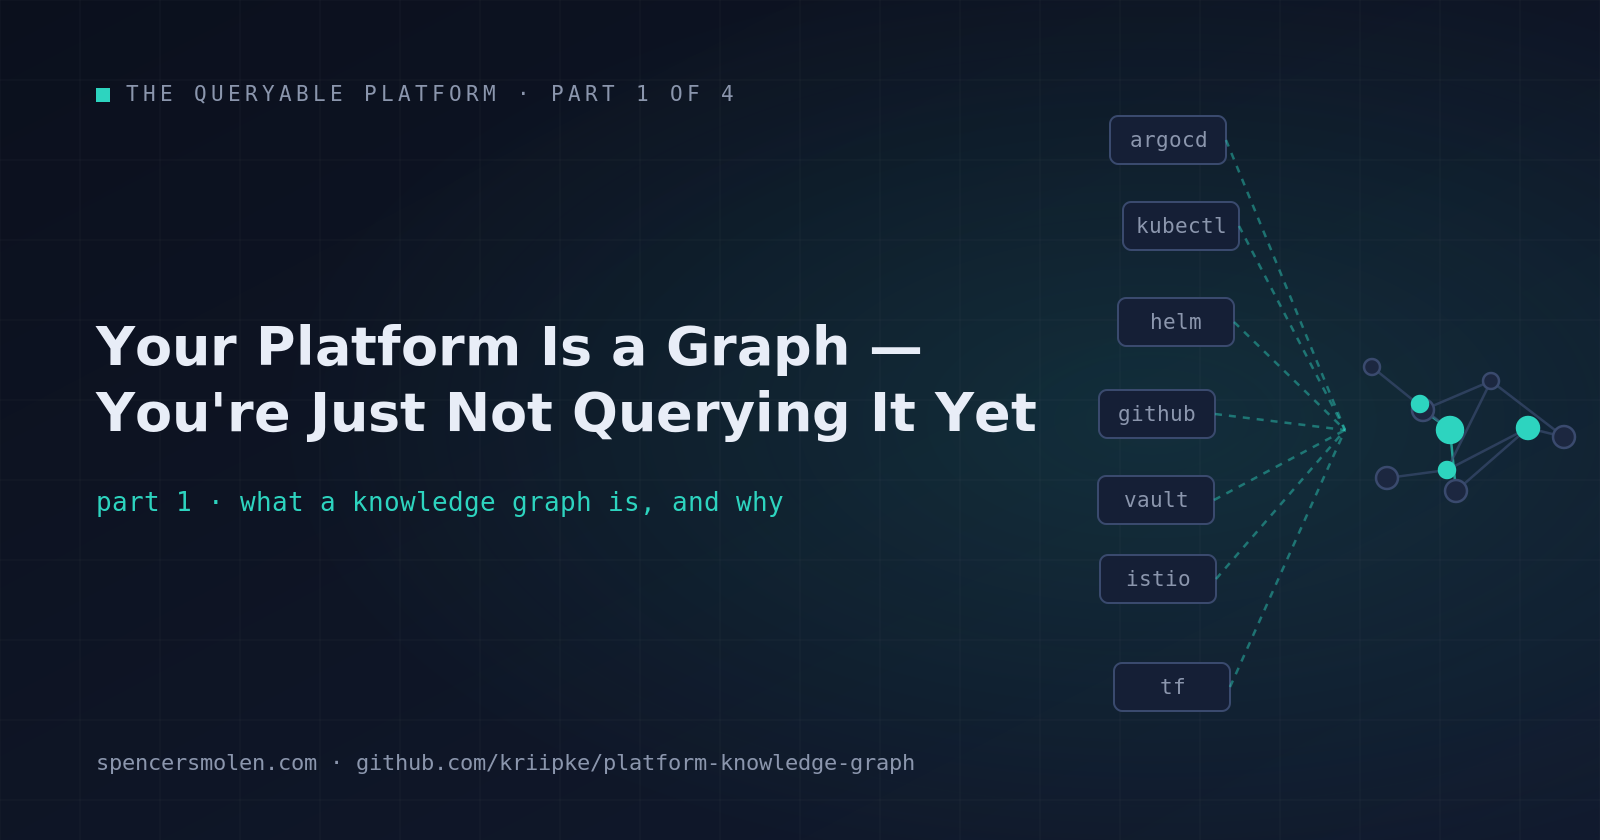
Each of those questions crosses at least two systems. The ArgoCD API knows about applications. Kubernetes knows about workloads. GitHub knows about repos and owners. Terraform state knows about databases. Vault knows about secrets. Istio knows about routes. Every one of these tools has a perfectly good API, and not one of them can answer a question that spans into its neighbor’s territory.
So we do the joins by hand. We open four browser tabs, grep two repos, and hold the intermediate results in our head. The senior engineers on the team are, functionally, biological join engines — and when they go on vacation, the join capacity of the team drops in half.
A knowledge graph is where those joins get done once, ahead of time, and stored. Each tool gets a small extractor that pulls out its facts and writes them as triples into one shared vocabulary. The ArgoCD extractor says payment-api declaredIn payments/payment-api. The GitHub extractor says payments/payment-api ownedBy payments-team. Neither tool knows about the other, but in the graph those two triples connect — and now “who owns the thing this Argo app deploys” is a two-hop query instead of a two-tab investigation.
Think of it like a city map assembled from surveys. Each utility company — water, power, fiber — knows exactly where its own lines run and nothing about anyone else’s. Dig a hole based on any single map and you’re gambling. The knowledge graph is the overlay where all the surveys land on the same coordinate system, so before you dig you can see everything under the ground at once.
Why not just use a CMDB or a spreadsheet?
Fair question — inventory systems are not a new idea. The difference is in two places.
First, the shape of the data. A spreadsheet (or a relational CMDB) forces you to decide your columns up front, and infrastructure relationships are stubbornly irregular: one service has three ingresses, another has none; one is deployed by Argo, another by a bare kubectl in a pipeline someone wrote in 2021. Graphs don’t mind irregularity — a node has exactly the edges it has.
Second, the freshness. Traditional CMDBs die the same death every time: they’re populated by hand, they drift from reality within a month, and then nobody trusts them, which means nobody updates them, which means they drift faster. The graph we’ll build is extracted from the live systems — the cluster, the ArgoCD API, the Terraform state — on every run. It’s not documentation that describes the platform; it’s a continuously refreshed model of the platform. When reality changes, you rerun the pipeline and the graph changes with it.
That freshness property is what makes everything downstream possible: impact analysis, policy checks, and — as we’ll get to later in the series — agents that can reason about your infrastructure instead of guessing at it.
What we’ll build
In the next article we’ll get our hands dirty with a working implementation: a repo called platform-kg that extracts triples from ArgoCD, Kubernetes, Helm, GitHub, GitHub Actions, Terraform state, Vault, and Istio, stitches them together into one Turtle file, validates it, and loads it into a graph database — all wired up so that make graph rebuilds the whole thing from scratch. We’ll walk through the schema, every extractor, and the pipeline that ties it together, and then run our first real queries against it.