In the last article we covered what a knowledge graph is and why a platform engineer would want one. Now let's actually build the thing — a graph database running locally, populated with triples describing your real cluster, with your first cross-tool query run against it.
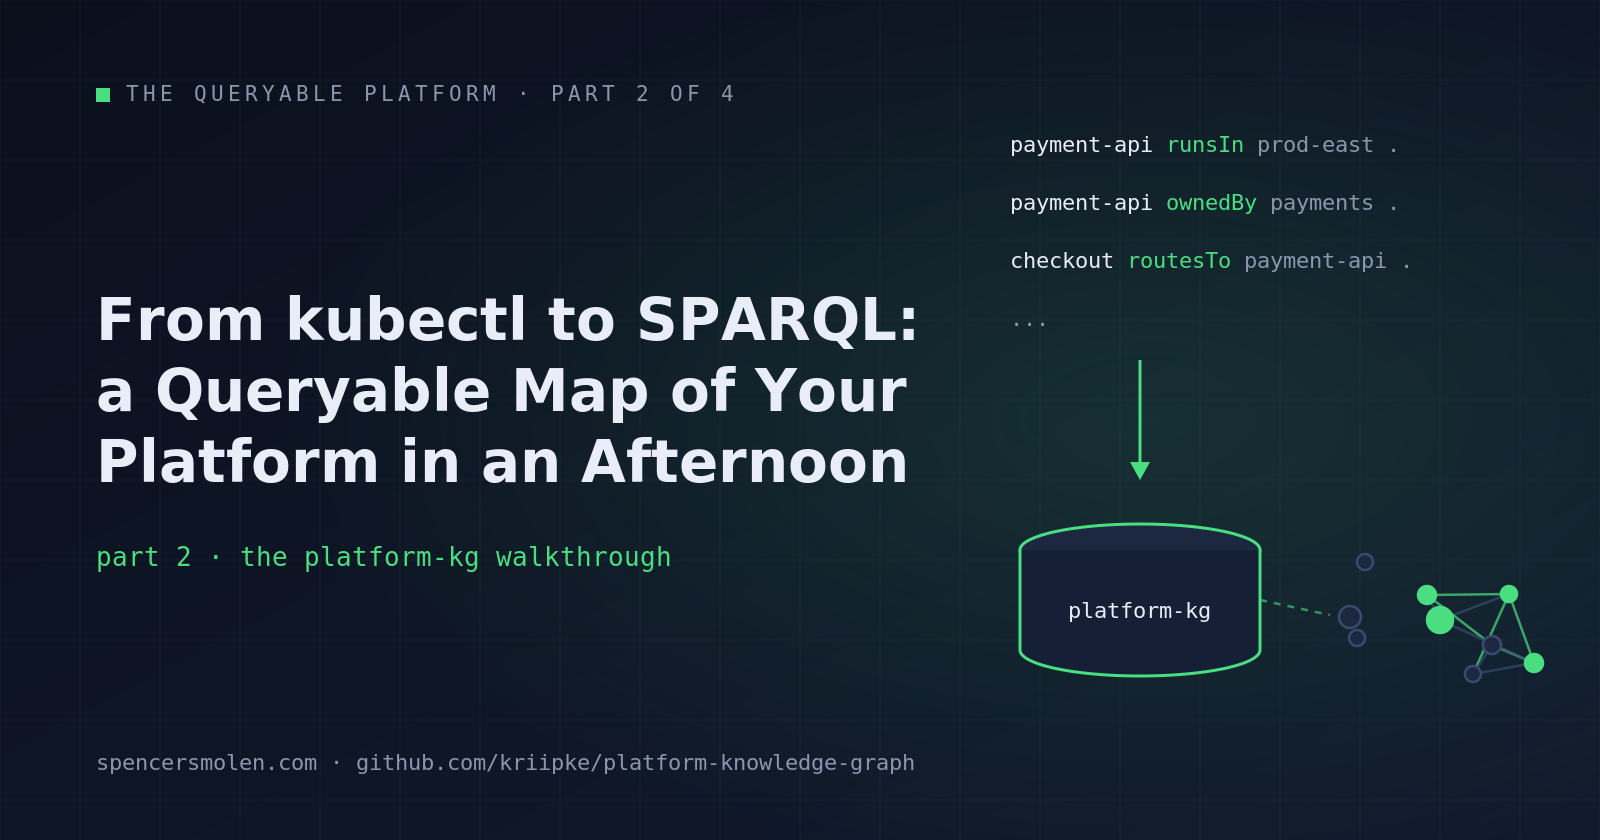
From kubectl to SPARQL: Build a Queryable Map of Your Platform in an Afternoon
The Queryable Platform, part 2 of 4 — a series on building an infrastructure knowledge graph and putting agents on top of it. (Part 1 · Part 3 · Part 4)
In the last article we covered what a knowledge graph is and why a platform engineer would want one: a continuously refreshed model of your infrastructure, assembled from the tools you already run, queryable with SPARQL. Now let’s actually build the thing.
The project we’re walking through is platform-kg — you’re welcome to clone it and follow along. It’s a Python repo that extracts facts from eight sources — ArgoCD, Kubernetes, Helm, GitHub, GitHub Actions, Terraform state, Vault, and Istio — turns them into RDF triples, validates the result, and loads it into GraphDB. By the end of this article you’ll have a graph database running locally in Docker, populated with triples describing your actual cluster, and you’ll have run your first cross-tool query against it in a browser.
Here’s the lay of the land:
platform-kg/
├── Makefile
├── config.example.yaml
├── ontologies/
│   └── kg.ttl              # the schema
├── etl/
│   ├── common.py           # shared plumbing
│   ├── argocd.py           # one extractor per source
│   ├── k8s.py
│   ├── helm.py
│   ├── github.py
│   ├── ghactions.py
│   ├── terraform.py
│   ├── vault.py
│   └── istio.py
├── pipeline/
│   └── build_graph.py      # ties it all together
├── shacl/
│   └── shapes.ttl          # data quality rules
└── examples/sparql/        # starter queries
How to read this article: the first half is a tour of the code, so you know what you’re about to run; the second half is the hands-on setup. If you’d rather run first and read later, jump straight to “Standing it up” — the tour will still be here when something makes you curious.
The schema
Everything starts with ontologies/kg.ttl. If the word “ontology” sounds intimidating, take a look at the file — it’s about 60 lines, and most of them look like this:
kg:Cluster a rdfs:Class .
kg:Namespace a rdfs:Class .
kg:Service a rdfs:Class .
kg:HelmRelease a rdfs:Class .
kg:VaultPath a rdfs:Class .
kg:ArgoApplication a rdfs:Class ; rdfs:subClassOf kg:Service .
That’s the whole trick: declare the kinds of things that exist (Cluster, Service, Pipeline, Team, Repository, HelmChart, VaultMount, the Istio resource types), declare the properties that describe them (s:name, kg:env, kg:image, kg:syncStatus), and declare the relationships that connect them:
kg:runsIn a owl:ObjectProperty .
kg:inNamespace a owl:ObjectProperty .
kg:deployedBy a owl:ObjectProperty .
kg:ownedBy a owl:ObjectProperty .
kg:routesTo a owl:ObjectProperty .
kg:usesVaultPath a owl:ObjectProperty .
This vocabulary is the contract every extractor writes against. The ArgoCD extractor and the Kubernetes extractor never talk to each other, but because they both emit kg:inNamespace edges pointing at the same namespace URIs, their facts snap together in the graph. That’s the whole design, honestly — a small shared vocabulary and a pile of independent extractors.
The shared plumbing
Before the extractors, a quick look at etl/common.py, because every extractor leans on it. Three pieces matter.
First, load_config reads config.yaml and runs every string through os.path.expandvars. That’s why the config can say token: "${ARGOCD_TOKEN}" — the actual secrets live in environment variables and never get committed. Nothing fancy, but it means you can check your config into git without wincing.
Second, uri() and slug() mint identifiers. uri('svc', 'payment-api') gives you ex:svc:payment-api, with slug normalizing whatever messy name came out of the source system. This pair is quietly the most important code in the repo: two extractors produce connectable facts only if they mint the same URI for the same real-world thing. The Kubernetes extractor names a workload uri('svc', name) and the Istio extractor names a route destination uri('svc', host_to_service(host)) — and because both funnel through the same slug, the edges land on the same node.
Third, TurtleWriter is a tiny class that accumulates triples and serializes them as Turtle. Each extractor exposes the same two functions — extract(cfg) to fetch raw data and to_turtle(data, cfg) to emit triples — so adding a ninth source is just a matter of writing one more file with that shape.
The extractors
I won’t paste all eight files here — they’re short and the repo is right there — but each one is worth a few sentences, because each one made a decision worth understanding.
ArgoCD
Hits the ArgoCD REST API (/api/v1/applications) with a bearer token and emits a kg:ArgoApplication per app, carrying its sync status, health status, target revision, and source repo. It also mints the namespace and cluster nodes from each app’s destination and links the app into them. If the app’s source declares a Helm chart, that becomes a kg:hasHelmChart edge. ApplicationSets come along for the ride via a second endpoint, wrapped in a try because not every ArgoCD install exposes it.
Kubernetes
Shells out to kubectl get ... -o json for namespaces, Deployments, StatefulSets, DaemonSets, Services, and Ingresses. Workloads become kg:Service nodes with their kind and first container image. Two details worth noting: ownership is inferred from the app.kubernetes.io/part-of or team label if present, and ingress rules generate kg:routesTo / kg:exposes edges between the ingress and its backend services — that’s the “what’s exposed to the internet” data from part 1.
Helm
Here’s a decision I like: this extractor never calls the helm CLI at all. It reads the standard labels Helm already stamps onto workloads — app.kubernetes.io/instance, helm.sh/chart, app.kubernetes.io/managed-by — via kubectl. That’s because the labels are already sitting on every object in the cluster, so you get release-to-chart-to-service edges without needing Helm access or release history. Anything not managed by Helm is skipped by a label check.
GitHub and GitHub Actions
The github extractor walks your configured repos, fetches CODEOWNERS over the API, and turns each @team mention into a kg:Team node with kg:ownedBy edges from both the repo and the service. The ghactions extractor parses workflow YAML files and applies two honest heuristics: a workflow is a deploy pipeline if it mentions keywords like deploy, helm, or terraform, and it targets a namespace if the workflow text mentions an environment name from your env_to_namespace mapping. Are keyword heuristics crude? Sure. But they get you service → deployedBy → pipeline → deploysTo → namespace edges on day one, and you can refine them later.
Terraform and Vault
The terraform extractor parses state files (local paths, or s3:// URIs via the AWS CLI) and pulls out resources matching configurable type lists — aws_db_instance, google_sql_database_instance, and friends become kg:Database nodes; buckets become storage resources. Every one gets a kg:managedBy edge back to its kg:TerraformResource, so “which databases does Terraform know about” is a one-hop query.
The vault extractor deserves one caveat called out loudly: it never reads secret values. It models the shape of Vault — mounts, ACL policies, and (optionally, off by default) KV metadata paths. That gives you kg:VaultMount and kg:VaultPath nodes to hang dependencies off of, without your knowledge graph becoming a secrets exfiltration incident waiting to happen.
Istio
Fetches VirtualServices, Gateways, ServiceEntries, and DestinationRules via kubectl. VirtualServices get kg:routesTo edges to the services behind their route destinations, using a simple host_to_service helper that takes the first segment of the destination host. ServiceEntries capture your external dependencies — extremely useful when someone asks “what third-party hosts does prod actually talk to?”
The pipeline
pipeline/build_graph.py is the conductor, and it’s short enough to read in one sitting. It loads the config, reads the ontology as the first chunk of output, then loops through the extractor list. Each enabled extractor runs inside a try/except that prints a warning and moves on:
try:
    print(f"running extractor: {name}")
    parts.append(run_extractor(name, cfg))
except Exception as e:
    print(f"WARN extractor failed: {name}: {e}")
That fail-soft behavior is deliberate. Your Vault token will expire. Someone will rename an ArgoCD project. When that happens you want a graph that’s missing one source, not no graph at all — a partial refresh still beats last week’s data.
The chunks get joined into dist/platform-kg.ttl, and then comes my favorite line in the file:
Graph().parse(str(out), format="turtle")
print("ttl validation passed")
The script re-parses its own output with rdflib before doing anything else with it. If any extractor emitted malformed Turtle — an unescaped quote from a weird resource name, say — the build fails right there, instead of GraphDB rejecting a 40MB upload with a line number you’ll be hunting for all afternoon. If you pass --upload, the validated Turtle gets POSTed to your GraphDB repository’s /statements endpoint with basic auth. There’s also a shacl/shapes.ttl with SHACL constraints (every service must have a name, every namespace must run in exactly one cluster) — we’ll put those to work in part 3.
Standing it up
Alright, enough reading code — let’s run it. All you need on your machine is Docker, Python 3, and a kubectl context pointed at a cluster you can read from.
Step 1: Start GraphDB locally
We need somewhere to put the triples. GraphDB’s free edition runs happily as a single container:
docker run -d \
  --name graphdb \
  -p 7200:7200 \
  ontotext/graphdb:latest
Give it a few seconds to boot, then open http://localhost:7200 in your browser. This is the GraphDB Workbench — a web UI where you can manage repositories, browse the data, and run SPARQL interactively. Head to Setup → Repositories → Create new repository and create one named:
platform-kg
The defaults are fine. A “repository” in GraphDB terms is just a named database — the thing our pipeline will POST triples into.
Step 2: Install the Python dependencies
git clone https://github.com/kriipke/platform-knowledge-graph.git
cd platform-knowledge-graph
cp config.example.yaml config.yaml
python3 -m venv .venv
source .venv/bin/activate
pip install -r requirements.txt
The requirements are refreshingly short: PyYAML, requests, rdflib, and python-hcl2. (The Makefile will actually create the venv for you on first run, but doing it by hand once means you can poke at things in a REPL later.)
Step 3: Configure it — and start small
Here’s the most important piece of advice in this whole article: don’t enable all eight extractors on your first run. Each integration is a chance for an expired token, a missing permission, or an endpoint that’s not where the config thinks it is, and debugging all eight at once is a miserable way to spend an evening. Start with the ones that only need your existing kubectl access plus ArgoCD:
extractors:
  argocd: true
  k8s: true
  helm: true
  github: false
  ghactions: false
  terraform: false
  vault: false
  istio: true
Then point the Kubernetes section at your cluster context:
kubernetes:
  context: "your-cluster-name"
  kubectl: "kubectl"
  namespaces_exclude:
    - kube-system
    - kube-public
    - kube-node-lease
The namespaces_exclude list keeps system namespaces out of the graph — you can also flip it around and use namespaces_include to scope a first run down to a single namespace you know well, which makes the output much easier to sanity-check by eye.
Set your ArgoCD server:
argocd:
  server: "https://argocd.your-domain.com"
And make sure your GraphDB endpoint points at the local container and repository you just created:
graphdb:
  endpoint: "http://localhost:7200/repositories/platform-kg/statements"
Finally, export the credentials. Since local GraphDB ships with no auth, empty values are fine for those two:
export ARGOCD_TOKEN="..."
export GRAPHDB_USER=""
export GRAPHDB_PASS=""
Step 4: Generate the Turtle locally first
Before touching the database, build the file on its own:
make ttl
You’ll see each extractor report in as it runs:
running extractor: argocd
running extractor: k8s
running extractor: helm
running extractor: istio
wrote dist/platform-kg.ttl
ttl validation passed
Now take a minute to actually look at what came out — there’s something satisfying about scrolling through a few thousand triples that describe your actual platform:
head -100 dist/platform-kg.ttl
This step matters more than it looks. The .ttl file is plain text, and reading it is how you build trust in the graph before you build anything on the graph. You should recognize your own infrastructure in there — your namespaces, your Argo apps with their sync status, your workloads with their images:
ex:svc:payment-api a kg:ArgoApplication ;
  s:name "payment-api" ;
  kg:syncStatus "Synced" ;
  kg:healthStatus "Healthy" ;
  kg:lastSeen "2026-07-07T14:12:03+00:00"^^xsd:dateTime .
ex:svc:payment-api kg:inNamespace ex:ns:payments .
ex:ns:payments kg:runsIn ex:cluster:prod-cluster-east .
If something looks wrong — a namespace you excluded showing up, a service with a mangled name — this is the cheap place to catch it.
Step 5: Upload to GraphDB
Once the file looks right:
make graph
(Or directly: python pipeline/build_graph.py --upload.) This rebuilds the Turtle and POSTs it to your repository endpoint. From here on out, this one command is your refresh button — cron it, stick it in a pipeline, whatever fits your setup.
Step 6: Run your first query
Back in the GraphDB Workbench at http://localhost:7200, select the platform-kg repository and open the SPARQL tab. Paste this in:
PREFIX kg: <https://example.com/kg/>
PREFIX s:  <http://schema.org/>

SELECT ?svcName ?nsName ?clusterName WHERE {
  ?svc a kg:Service ;
       s:name ?svcName ;
       kg:inNamespace ?ns ;
       kg:runsIn ?cluster .
  ?ns s:name ?nsName .
  ?cluster s:name ?clusterName .
}
ORDER BY ?clusterName ?nsName ?svcName
Hit run, and there it is: every service on your platform, with its namespace and cluster, in a sortable table. It’s a humble first query, but pause on what just happened — those rows were assembled from kubectl output and the ArgoCD API, merged on shared URIs, and answered by a database that knows nothing about Kubernetes. Hopefully you’re having an “ah-ha” moment right now, because this is exactly the cross-tool join we spent part 1 complaining about doing by hand.
The repo ships with more starters in examples/sparql/ — service-deployment-path.rq adds the deploying pipeline to each row, and istio-routes.rq lists every VirtualService with its host and the service it routes to.
Step 7: Turn on the rest, one at a time
Now that the core loop works, go back to config.yaml and enable the remaining extractors one by one, running make ttl between each:
github: true      # needs GITHUB_TOKEN; fills in repos, CODEOWNERS, teams
ghactions: true   # parses workflow files; adds deployedBy/deploysTo edges
terraform: true   # point state_paths at a real state file
vault: true       # needs VAULT_TOKEN; adds mounts and policies
Each one enriches the graph with a new kind of edge, and each one has its own credentials and config to get right — which is exactly why we didn’t do this on step one. When an extractor misbehaves, the fail-soft pipeline will print a WARN and keep going, so you can debug the newcomer without losing the graph you already have.
Don’t want to run GraphDB at all yet? That’s fine too — rdflib can execute SPARQL directly against the .ttl file in a few lines of Python. Start local, graduate to a real triplestore when the graph earns it.
You’re more than welcome to clone the repo and adapt any of this — the extractors are deliberately small so you can bend them to your own labels, naming conventions, and stack.
At this point you have a living graph of your platform and a refresh button. In the next article we’ll look at what it’s actually for: the ladder of uses that runs from inventory to topology to impact analysis to governance — and a fifth rung that deserves an article of its own.