You now have triples describing your actual platform and a GraphDB Workbench to query them. Every useful thing you can do with a platform knowledge graph is a rung on the same ladder — let's climb it, with real queries at every step.
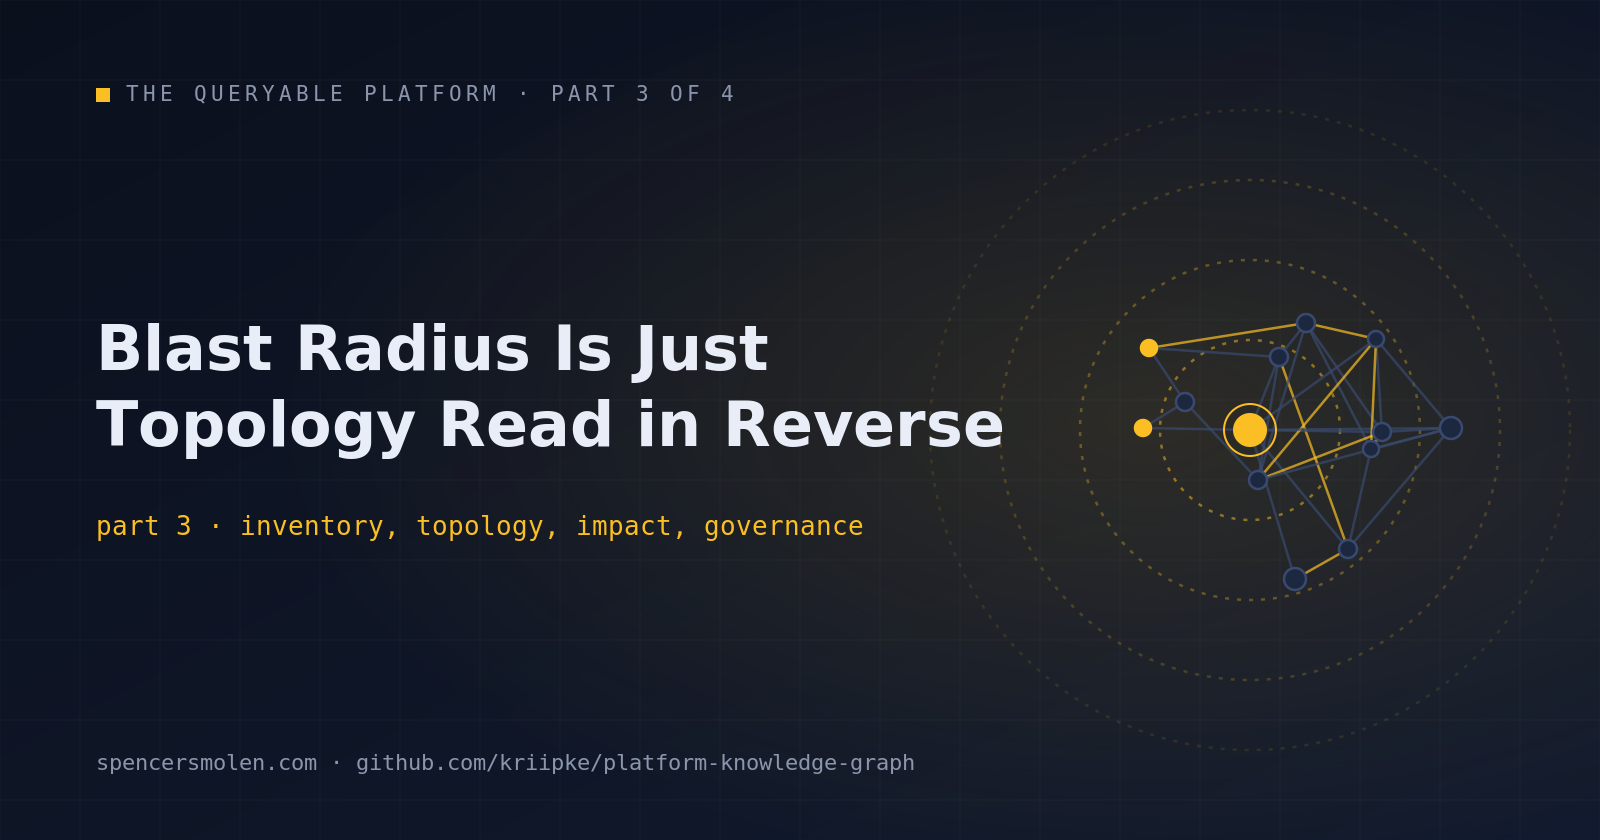
Blast Radius Is Just Topology Read in Reverse
The Queryable Platform, part 3 of 4 — a series on building an infrastructure knowledge graph and putting agents on top of it. (Part 1 · Part 2 · Part 4)
If you followed along with part 2, you now have a dist/platform-kg.ttl full of triples describing your actual platform — services, namespaces, clusters, Argo apps, Helm releases, repos, teams, pipelines, Terraform resources, Vault mounts, Istio routes — and a GraphDB Workbench where you can query all of it. Which raises the obvious question: now what?
It turns out there isn’t one answer — there’s a ladder of them. Every useful thing you can do with a platform knowledge graph is a rung on the same ladder, and each rung is built on the one below it. Let’s climb it, with real queries at every step.
Stage 1 — Inventory: “What exists?”
The first rung is the least glamorous and the most immediately useful: the graph as the single place where “what do we run?” gets answered.
Picture the moment this replaces. A new engineer joins the team and asks what runs in the payments namespace. Today the answer is a tour: here’s the ArgoCD UI, here’s the GitHub org, here’s the wiki page that was accurate in 2024, and here’s the Slack channel where you ask when those disagree. With the graph, the answer is a query:
SELECT ?service ?kind ?image WHERE {
  ?svc a kg:Service ; s:name ?service ;
       kg:inNamespace ?ns .
  ?ns s:name "payments" .
  OPTIONAL { ?svc kg:kind ?kind . }
  OPTIONAL { ?svc kg:image ?image . }
}
Every workload in the namespace, its kind, and the exact image it’s running. Swap the pattern around and you get the other inventory classics for free: every Argo app that isn’t Synced and Healthy (the extractor already captured kg:syncStatus and kg:healthStatus), every database Terraform manages, every ACL policy in Vault, every external host declared in a ServiceEntry.
Don’t underrate this rung. The first time a new hire answers their own question with a query instead of a Slack message, the graph has started paying rent. And unlike every hand-maintained service inventory you’ve watched rot, this one is regenerated from the live systems on every make graph, so it can’t drift — the kg:lastSeen timestamp on each node tells you exactly how fresh it is.
Stage 2 — Topology: “How are things connected?”
The second rung is where the graph stops being a list and starts being a graph. Multi-hop queries walk edges that no single source system contains.
Here’s a concrete one. Someone asks: “for everything in prod, who owns it, and what pipeline deploys it?” That answer spans kubectl labels, CODEOWNERS files, and workflow YAML — three sources, three extractors, one query:
SELECT ?service ?team ?pipeline WHERE {
  ?svc a kg:Service ; s:name ?service ;
       kg:inNamespace ?ns .
  ?ns s:name "prod" .
  OPTIONAL { ?svc kg:ownedBy ?owner . ?owner s:name ?team . }
  OPTIONAL { ?svc kg:deployedBy ?pipe . ?pipe s:name ?pipeline . }
}
Note the OPTIONAL blocks — they’re doing something sneaky and useful. Rows where ?team comes back empty aren’t query failures; they’re findings. That’s your list of unowned production services, and you got it as a byproduct of asking a different question. Graphs are good at exposing the missing edge, and we’ll lean on that hard in stage 4.
The route side is just as handy. examples/sparql/istio-routes.rq gives you every VirtualService, its public host, and the service behind it — effectively a generated map of your ingress surface. Architecture diagrams that were drawn once in 2023 and never updated can now be generated, because the topology is data. Feed the query results into Graphviz or Mermaid and you have a diagram that’s accurate by construction, every time you rebuild it.
Stage 3 — Impact: “What happens if something changes or fails?”
Back to the alerting story from part 1. The failures that hurt us were never the outages — those we caught at the edge. It was when something three or four hops deep got slow. Not down — slow. The edge still answered, the synthetic checks still passed, and the degradation rippled outward toward customers while every dashboard stayed green. And before you say it: yes, we had tracing. Traces tell you the path a request took — afterward, for the requests that got sampled. What we needed was the path ahead of time, as data, so we could hang alert conditions on it. We had all the metrics in the world and no model to hang them on.
That model is this rung. Once topology is queryable, blast radius is just topology read in reverse.
Let’s make it specific. It’s Tuesday, and you need to rotate the Postgres instance behind the payments stack. The old ritual: open the Terraform repo to find the instance, grep a couple of app repos for the hostname, check which namespaces have workloads mentioning it, ask in two channels whether anything else touches it, and then do the change anyway with one eye on the dashboards. The graph version walks from the database, through its Terraform resource, out to everything connected — one honest caveat first, though: it leans on kg:dependsOn edges, which the starter extractors don’t emit yet. This is the query the whole rung is building toward, and the one extractor you’ll want to write to light it up:
SELECT ?database ?tfResource ?service ?namespace WHERE {
  ?db a kg:Database ; s:name ?database ;
      kg:managedBy ?tf .
  ?tf s:name ?tfResource .
  OPTIONAL {
    ?svc kg:dependsOn ?db ; s:name ?service ;
         kg:inNamespace ?ns .
    ?ns s:name ?namespace .
  }
}
One result set: the database, the Terraform resource that manages it, and every service and namespace in the blast radius. From there it’s one more hop to the pipelines that deploy those services and the routes that expose them — so your pre-change checklist writes itself, and it’s grounded in the platform as it is today, not as someone remembered it.
That missing extractor is less work than it sounds: parse your Helm values or service configs for database hostnames and Vault paths, emit a kg:dependsOn triple per match. An afternoon, honestly — and it’s the highest-value afternoon in this whole project, because every edge it adds makes this rung sharper. It’s also, hop for hop, exactly the dependency enumeration my old team needed and didn’t have.
The same shape answers the incident-time version of the question. When payment-api starts throwing 500s, the first two questions in the channel are always “what does it depend on?” and “what changed recently?” Both are edge-walks: the dependency query above pointed downstream instead of up, and a filter on kg:lastSeen and kg:syncStatus for things ArgoCD touched in the last few hours. Wire those two queries into a PR comment bot or an Argo pre-sync check and you’ve turned the graph into a pre-change safety system rather than a post-incident archaeology tool.
Stage 4 — Governance: “What should or should not be allowed?”
The fourth rung flips the direction of the queries. Instead of asking what exists, you assert what ought to exist, and let the graph surface violations.
The repo already has the seed of this in shacl/shapes.ttl — SHACL is a W3C standard for exactly this job, constraints over RDF data. The starter shapes are modest:
kg:NamespaceShape a sh:NodeShape ;
  sh:targetClass kg:Namespace ;
  sh:property [ sh:path s:name ; sh:minCount 1 ] ;
  sh:property [ sh:path kg:runsIn ; sh:minCount 1 ; sh:maxCount 1 ] .
“Every namespace must have a name and must run in exactly one cluster.” Not exactly thrilling — but the pattern extends as far as you care to push it, and this is where it gets good. Every production service must have a kg:ownedBy edge. Every service with a public route must have TLS termination defined. No workload may reference a Vault mount outside its namespace boundary. Every prod workload must be managed by ArgoCD. Each of those is a shape or a SPARQL ASK query, versioned in git, evaluated against the whole platform on every refresh — policy checks that used to be scattered across Terraform linting, admission controllers, and hand-built scripts, expressed once against the unified model.
And the quiet superpower is finding the things that shouldn’t be there. Here’s an orphan-hunter you can run today:
SELECT ?route ?deadService WHERE {
  ?vs a kg:VirtualService ; s:name ?route ;
      kg:routesTo ?svc .
  FILTER NOT EXISTS { ?svc kg:lastSeen ?seen . }
  BIND(STRAFTER(STR(?svc), "svc:") AS ?deadService)
}
Every Istio route pointing at a service the Kubernetes extractor never saw — routes to nowhere. Note the BIND on the last line: a service the cluster extractor never saw has no name triple, which is precisely what makes it dead. The URI itself is the evidence. The same FILTER NOT EXISTS trick finds workloads with no Argo app behind them, Terraform resources no service consumes, and Vault paths nothing references. Orphans and drift are nearly impossible to spot from inside any single tool, because each tool only sees its own half of the broken edge. In the graph, a dangling edge is a query away.
Stage 5 — Automation: “How can the platform act intelligently?”
The top rung: the graph as the substrate for software that acts on the platform rather than just describing it.
Notice the shape of the ladder before we climb this last rung, because it’s the real thesis of this series. Inventory tells you what exists. Topology tells you how it’s connected. Impact tells you what happens when it changes. Governance tells you what’s allowed. Automation is the platform acting on all of the above. Each stage is strictly built from the ones below it — you can’t compute blast radius without topology, and you shouldn’t automate anything you can’t govern. That progression is the maturation path I’d design around, and it’s why the boring rungs matter: they’re load-bearing.
Some of that automation is plain old software: a cron job that runs the orphan queries and files tickets, a deployment gate that refuses to ship a service with no owner. All of it is just the stage 3 and 4 queries with a scheduler attached.
But there’s a newer consumer of this graph, and in 2026 it’s the most important one: LLM agents. An agent without the graph is guessing about your platform from grep results. An agent with it can look facts up before acting. That difference deserves more than a paragraph — in the final article, we’ll wire an agent to the graph and walk through four I’d actually build: an incident triage agent, a change-impact reviewer, an environment provisioner, and a drift janitor.